Reading practice statistics: what the numbers tell you
Practice time and streaks alone say little. How to read statistics and distribution to see what is really happening in practice.
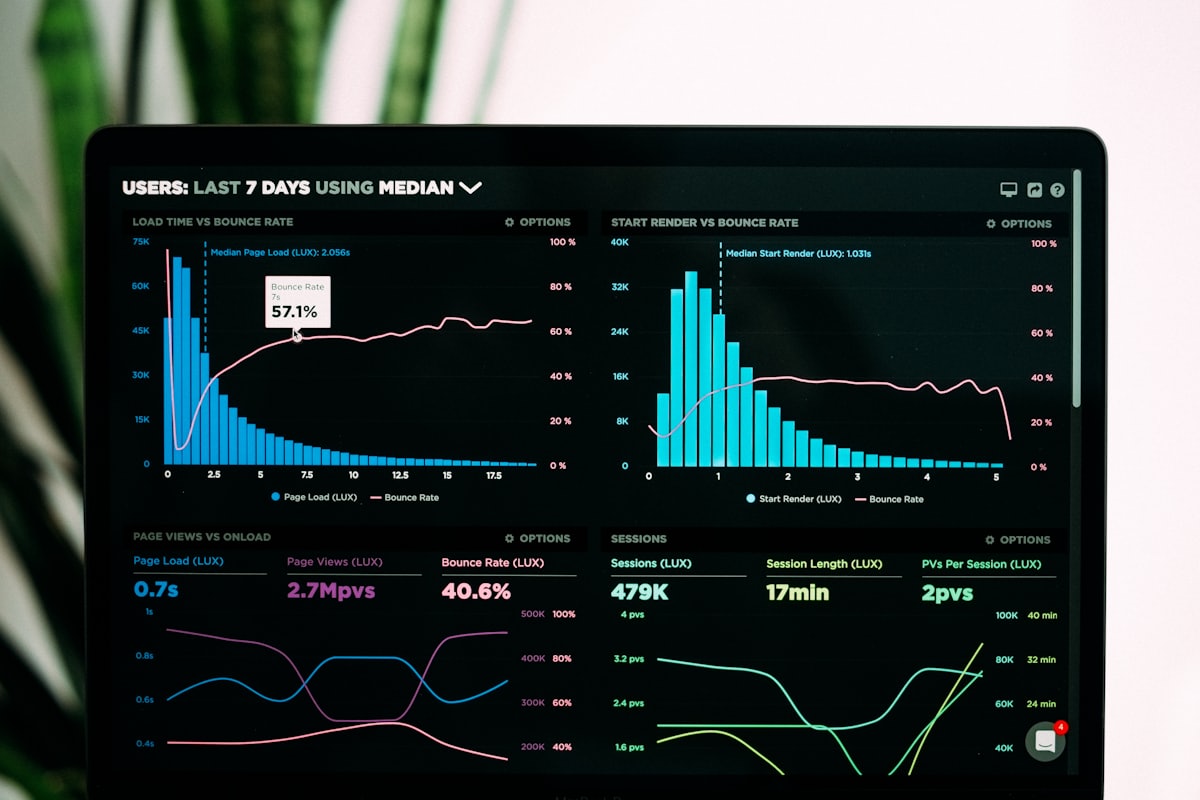
Practice numbers are tempting: total time, streaks, averages. They feel objective and give the impression of having everything in view. But a number alone rarely tells the whole story.
What matters is how you read and interpret the numbers. Whoever only looks at minutes confuses activity with progress. This article shows how to read practice statistics properly.
Total time is only the beginning
Total time says how much was practised – not how well. Two students can practise the same amount and progress very differently. The number is a starting point, not a result.
It gets more interesting when you break the time down: how does it spread across pieces and categories? Where does it go, where is it missing?
Distribution instead of sum
A week with three hours of only scales looks good in total, but reveals an imbalance. The distribution shows what was actually practised – and what gets neglected.
Especially with several pieces, the distribution helps you see whether a student maintains everything evenly or focuses on a favourite piece and ignores the rest.
Regularity and gaps
Regularity is often more telling than the total. Twenty minutes daily is usually worth more for the learning process than two hours once a week. Gaps in the calendar show where everyday life pushed practice aside.
This is not about blame, but about patterns: a gap on Tuesday may have a concrete reason that can be cleared up in conversation.
Time of day as a hint
When someone practises says a lot about their circumstances. Whoever practises only late in the evening may be too tired for demanding passages. Whoever is productive in the morning should put the difficult spots there.
The time-of-day analysis is not an end in itself, but a hint on how to adapt practice recommendations to everyday life.
Connecting numbers with the student’s level
The best statistic is worthless if it is not combined with what you hear. High practice time with stagnating ability points to ineffective practice – worth a conversation. Low time with visible progress shows efficient work.
The numbers are an opening for conversation, not a judgement. They help you ask the right question.
Turn a statistic into a useful question
An unusual number is a reason to ask, not an explanation by itself. If practice time drops, first ask what the week was really like: was the instrument available, was it an unusually busy week, or was a clear goal achieved in less time? If time increases, the same curiosity helps: was the student focused on one passage, or mainly playing through the whole piece repeatedly?
This avoids jumping to conclusions and lets you connect the statistic with what you hear in the lesson. An open question such as “What helped your practice this week?” often leads further than a judgement about minutes. The answer may point to a new strategy, a realistic time window or an adjustment to the assignment.
Start with a few meaningful measures
More measures do not automatically provide more insight. Start with a question you genuinely want to answer and look only at the relevant information – regularity when you are exploring a workable routine, for example, or distribution when several pieces are being studied in parallel.
Discuss with the student which view is helpful and which might create pressure. You can observe a pattern for a limited period and then decide together whether anything should change. That keeps statistics a tool for planning and reflection rather than a judgement of effort or talent.
Choose measures that match the teaching question
Start with the question you want to answer, not with whichever chart happens to be available. If the goal is to practise more regularly, the spread across the week is more useful than total time. If a piece seems to have stalled, time by category may show whether the difficult passage is receiving attention at all. Connecting the measure to a teaching decision prevents collecting numbers simply because they are easy to count.
Explain to the learner why you are looking at a particular measure and what you hope to decide together. That keeps the review transparent. If a measure does not lead to a useful next question, it need not become part of the conversation. In teaching, a few well-understood details are often more valuable than a complete dashboard.
Compare before and after with care
A comparison is more meaningful when it covers similar periods and tasks. Do not compare a holiday week with an exam period without context. Instead, choose a manageable span, such as four teaching weeks, and ask whether distribution or regularity changed.
Even then, statistics are not an experiment that proves a cause. A change may be connected to a new timetable, a different assignment or a more workable routine. Use the comparison to form a hypothesis and check it in conversation: what changed for the learner, and what adjustment should you try next?
Turn a finding into a small experiment
Once you notice a pattern, choose one change and try it for a limited period. If the same passage is practised repeatedly without sounding more secure, divide the task into shorter sections or vary the repetitions more deliberately. An irregular pattern may call for a realistic weekly routine. Avoid changing several conditions at once so you can tell what actually helps.
At the next review, ask whether the experiment supported learning. The statistics may change while the musical result stays the same; improvement may also take longer to appear. Either way, you have a reason to adjust the task. Numbers help you remember the pattern, while decisions remain grounded in listening, conversation and the learning goal.
How MUSIRIS prepares the numbers
In MUSIRIS you see practice time, distribution, regularity and times of day bundled together – and can connect them with goals and repertoire. That turns raw data into a picture you can work with.
You can try MUSIRIS for free. Look at a student’s practice statistics and compare them with what you hear in the lesson.
No credit card · Ready in a few minutes